HOMEROS seismology notebook - 'Project funded by OSCARS - HOMEROS'
Authors/Creators

-
1.
 Aristotle University of Thessaloniki
Description
An open, end-to-end Jupyter notebook that builds an earthquake catalogue from continuous seismic waveforms using machine-learning phase picking. Starting from nothing but a station list and a date range, it downloads open FDSN data, picks P and S arrivals with a neural network, associates them into events, estimates local magnitudes, and exports a catalogue, a map, and a phase file ready for double-difference relocation.
The demo region is the central Ionian Islands and western mainland Greece, one of the study areas of the HOMEROS project (Harmonising Observations from Multi-hazard Environments in Research for Open Science). Nothing in the workflow is specific to that region: the search area, station list, and date range are all parameters in a single configuration cell.
What the notebook does
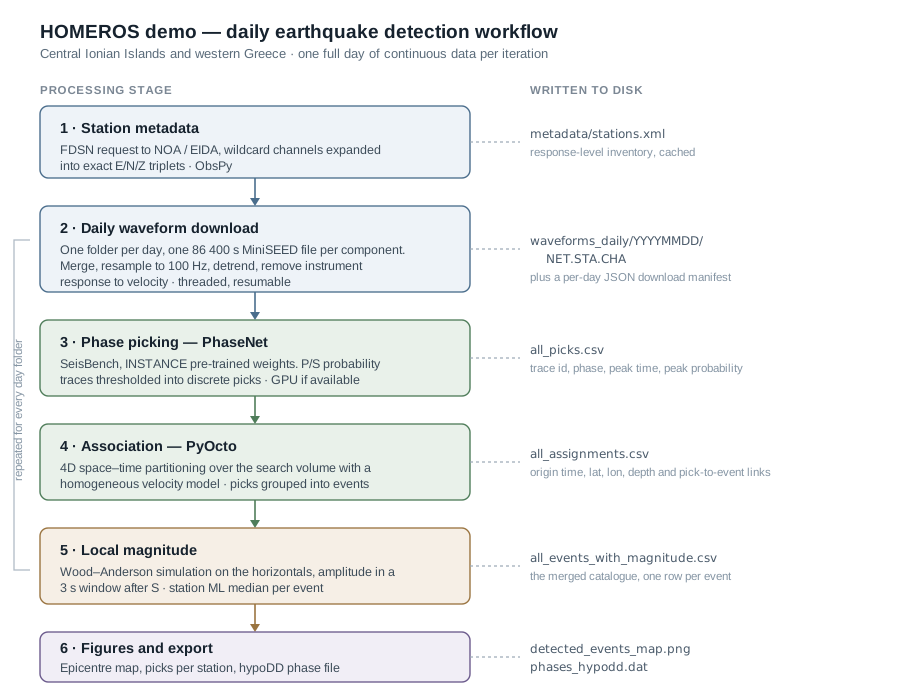
The workflow is organised as a daily batch pipeline, so it scales to long time spans without running out of memory. Each stage corresponds to a section of the notebook.
- Station metadata. A response-level StationXML inventory is requested from the configured FDSN providers (NOA, with EIDA as fallback). Wildcard channel requests are expanded against the inventory into exact three-component triplets, so only channels that actually exist are requested. The inventory is cached and reused on later runs.
- Daily waveform download. For each day, one folder is created and filled with one full-day (86 400 s) MiniSEED file per component. Each trace is merged, padded, resampled to a common sampling rate, detrended, and instrument-response-corrected at download time. Downloads run in a thread pool, fall back across providers, skip files already present, and record the outcome of every request in a per-day JSON manifest.
- Phase picking. PhaseNet is applied through SeisBench using the pre-trained INSTANCE weights. The network outputs continuous P and S probability traces, converted to discrete picks at a configurable threshold. A CUDA device is used automatically when available.
- Association. Picks are grouped into events with PyOcto, using 4D space–time partitioning over the configured latitude, longitude and depth volume with a homogeneous velocity model. Association runs day by day on a station table filtered to the stations that produced picks that day.
- Local magnitude. For each event, the horizontal components of each contributing station are simulated to a Wood–Anderson instrument, the peak amplitude is measured in a 3 s window anchored on the S pick, and a station ML is computed with a standard distance correction. The event magnitude is the median of the station values.
- Figures and export. The notebook maps epicentres and stations, plots associated picks per station, and writes a hypoDD-format phase file ready for double-difference relocation.
Demo run
The notebook is archived with the outputs of a two-day run over 23 requested stations from networks HT, HL, HP and HA, covering 1–2 March 2026: 3 494 PhaseNet picks, 28 associated events, and a local magnitude for every event. Two days is a demonstration size; the same notebook runs unchanged over months of data by changing a single parameter, since the per-day loop releases waveform memory and clears the GPU cache between days.
Outputs
- Per-day and merged pick tables, pick-to-event assignment tables, and an event catalogue in CSV, with one row per event giving origin time (UTC), latitude, longitude, depth, ML, and the number of stations used.
- Per-day download manifests and a processing summary recording traces, picks and events per day.
- An epicentre and station map, a picks-per-station figure, and a hypoDD-format phase file.
Scope and caveats
This is a teaching and demonstration workflow, not a production catalogue pipeline. Hypocentres are association-grade: they come from a homogeneous velocity model and are meant to be good enough to group picks, not to be final, which is why a hypoDD phase file is exported. Magnitudes are approximate, using a non-local distance correction with no station corrections and no distance or SNR cut-off. Detection completeness depends on the picking and association thresholds, which were not tuned for this region. Because traces are fetched live from FDSN services, a rerun may differ if a station's data or metadata have changed.
Requirements
Python 3.9 or later with SeisBench, PyOcto, ObsPy, PyTorch, Cartopy, NumPy, pandas and Matplotlib. A CUDA GPU speeds up picking considerably but is optional. Disk usage is roughly 1 GB per day for about 50 three-component stations at 100 Hz.
Software and references
- Woollam, J., Münchmeyer, J., Tilmann, F., et al. (2022). SeisBench — A toolbox for machine learning in seismology. Seismological Research Letters, 93(3), 1695–1709. https://doi.org/10.1785/0220210324
- Zhu, W., & Beroza, G. C. (2019). PhaseNet: a deep-neural-network-based seismic arrival-time picking method. Geophysical Journal International, 216(1), 261–273. https://doi.org/10.1093/gji/ggy423
- Michelini, A., Cianetti, S., Gaviano, S., et al. (2021). INSTANCE – the Italian seismic dataset for machine learning. Earth System Science Data, 13, 5509–5544. https://doi.org/10.5194/essd-13-5509-2021
- Münchmeyer, J. (2024). PyOcto: a high-throughput seismic phase associator. Seismica, 3(1). https://doi.org/10.26443/seismica.v3i1.1130
- Beyreuther, M., Barsch, R., Krischer, L., et al. (2010). ObsPy: a Python toolbox for seismology. Seismological Research Letters, 81(3), 530–533. https://doi.org/10.1785/gssrl.81.3.530
- Waldhauser, F., & Ellsworth, W. L. (2000). A double-difference earthquake location algorithm. Bulletin of the Seismological Society of America, 90(6), 1353–1368. https://doi.org/10.1785/0120000006
- Hutton, L. K., & Boore, D. M. (1987). The ML scale in southern California. Bulletin of the Seismological Society of America, 77(6), 2074–2094. https://doi.org/10.1785/BSSA0770062074
Data
Waveforms and station metadata are obtained from open FDSN services — the National Observatory of Athens (NOA) and EIDA nodes — for networks HT, HL, HP and HA. Please cite the network operators and data providers according to their own terms when publishing results derived from their data:
|
University of Athens. (2008). Hellenic Unified Seismological Network, University of Athens, Seismological Laboratory [Data set]. International Federation of Digital Seismograph Networks. https://doi.org/10.7914/SN/HA
|
Acknowledgements
Parts of this notebook were adapted from the example notebooks published by the SeisBench project, for which we are grateful. Developed within the HOMEROS project (Harmonising Observations from Multi-hazard Environments in Research for Open Science), supported by the OSCARS project, funded by the European Commission's Horizon Europe Research and Innovation programme under grant agreement No. 101129751.
Files
.zenodo.json
Files
(638.0 kB)
| Name | Size | Download all |
|---|---|---|
|
md5:ba8d0aa1a2ab377a70a91d31bcaeaadd
|
1.8 kB | Preview Download |
|
md5:2ebb0b85c1427161fc99e458a1b32ac9
|
2.8 kB | Download |
|
md5:a9dcdafaecacd79300bcf93787b3eabc
|
346.9 kB | Preview Download |
|
md5:058abbe652c7382ede57ba56231a34b0
|
223.5 kB | Preview Download |
|
md5:1ebbd3e34237af26da5dc08a4e440464
|
35.1 kB | Download |
|
md5:ab81b5fd2f53f72b2f46175f22c080bb
|
13.4 kB | Preview Download |
|
md5:77ea055ed1f7a4d77bfe89fdd46d51cb
|
140 Bytes | Preview Download |
|
md5:25b4fa5570457be94c8203d72913ab18
|
14.4 kB | Download |
Additional details
Funding
Software
- Programming language
- Python , Jupyter Notebook
- Development Status
- Active